TFA
3,124 ft2
Treated floor area
01
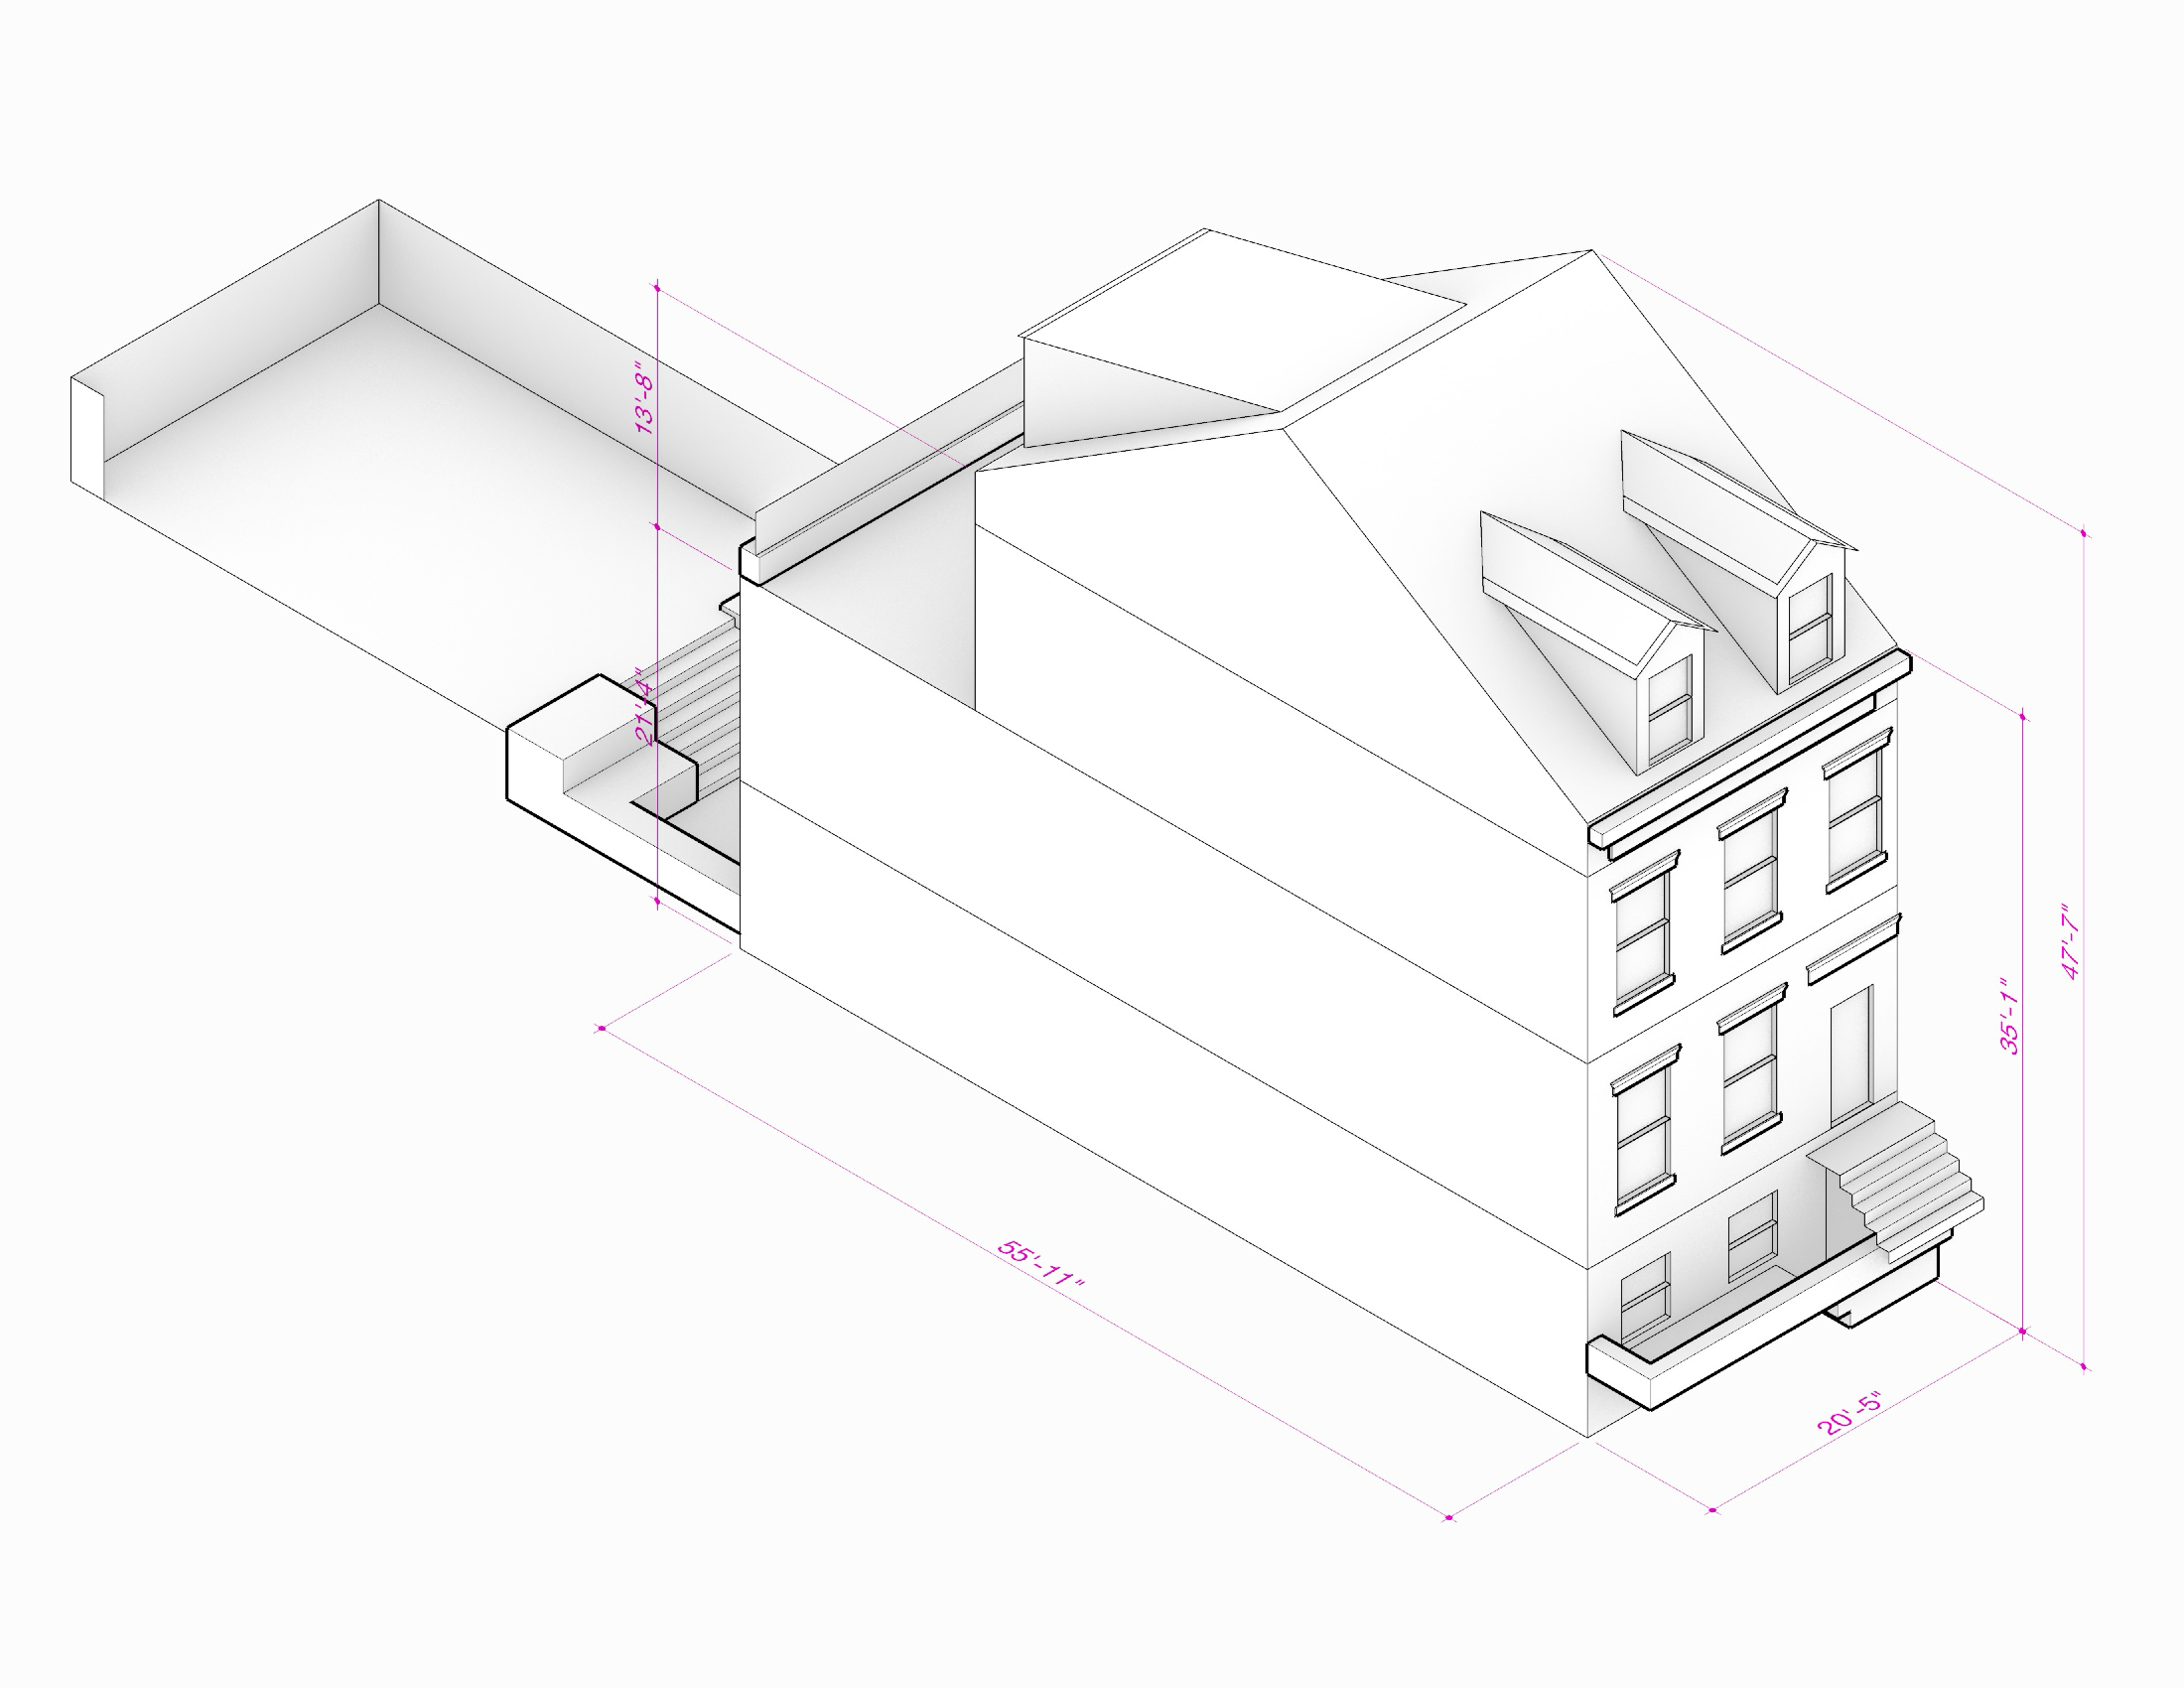
For all model results shown here, the following building geometry was used. This geometry is based on the drawings/models received on May 1, 2026. The model geometry used for this assessment includes both the building and the local shading context. For details on the context shading see the windows site shading section.
TFA
3,124 ft2
Treated floor area
Envelope Area
4,216 ft2
Thermal envelope area
Total Window Area
540 ft2
All orientations combined
02
As shown in the results below, in order to assess the building performance we have tested the building in five distinct configurations (variants):
Code-Minimum: A version which meets but does not exceed the NYC Energy Code 2025 / Zone 4(A) code minimums for assembly R-values, window U-values, airtightness and equipment efficiencies. This variant assumes a typical residential “extract-only” (bath fan) ventilation system, and that the building uses all-electric appliances and equipment for heating, cooling, hot-water and cooking.
Improved Envelope: This variant improves the window U-values, assembly R-values, and total airtightness of the building beyond the “code-minimum” levels, but not quite to full “Passive House” level.
Improved HVAC: This variant includes a dedicated fresh-air ventilation system with heat recovery (HRV). This system is assumed to be a “basic” HRV with 70% heat-recovery (unit). This variant shows a slight increase in the overall site-energy, due to the increased fan-energy needed.
PHI EnerPHit ‘By Component’ [RECOMMENDED]: A variant which meets the stringent Passive House Institute (PHI) EnerPHit (Energy Retrofit) standard’s prescriptive targets for envelope U-values, airtightness, windows, and equipment efficiencies. This variant also includes a high performance ERV system for fresh-air ventilation.
PHI EnerPHit ‘By Demand’ : A version which increases assembly R-values, window U-values, and mechanical system efficiencies to meet the PHI-EnerPHit ‘by Demand’ energy performance certification criteria. Due to the higher level of wall insulation required at the existing brick masonry, this variant is not recommended in this case.
| Metric | Code Minimum | Improved Envelope | Improved HVAC | RecommendedEnerPHit by Component | EnerPHit by Demand |
|---|---|---|---|---|---|
| Certification Compliant? | — | — | No | Yes | Yes |
| Total Primary EnergykWh/yr | 63,202 | 54,191 | 54,341 | 47,759 | 41,134 |
| Total Site EnergykWh/yr | 24,308 | 20,843 | 20,900 | 18,369 | 15,821 |
| Heat DemandkWh/yr | 18,508 | 13,119 | 11,304 | 7,604 | 5,672 |
| Heat DemandkWh/m2 | 63.8 | 45.2 | 38.9 | 26.2 | 19.5 |
| Cooling DemandkWh/yr | 3,109 | 3,051 | 3,236 | 3,349 | 2,924 |
| Total Cooling DemandkWh/m2 | 12.7 | 12.4 | 13.3 | 13.6 | 11.8 |
| Peak Heat LoadBtuh | 37,859 | 27,274 | 27,877 | 19,769 | 16,705 |
| Peak Sensible Cooling LoadBtuh | 15,116 | 12,963 | 12,695 | 11,365 | 10,030 |
| Peak Latent Cooling LoadBtuh | 5,766 | 5,424 | 6,721 | 5,983 | 4,108 |
| Metric | Code Minimum | Improved Envelope | Improved HVAC | RecommendedEnerPHit by Component | EnerPHit by Demand |
|---|---|---|---|---|---|
| TFAft2 | 3,124 | 3,124 | 3,124 | 3,124 | 3,124 |
| Building Envelope Areaft2 | 4,216 | 4,216 | 4,216 | 4,216 | 4,216 |
| Vn50ft3 | 25,626 | 25,626 | 25,626 | 25,626 | 25,626 |
| Gross Volumeft3 | 33,314 | 33,314 | 33,314 | 33,314 | 33,314 |
| Envelope Area To TFAft2/ft2 | 1.35 | 1.35 | 1.35 | 1.35 | 1.35 |
| Window Area (North)ft2 | 334 | 334 | 334 | 334 | 334 |
| Window Area (East)ft2 | 0 | 0 | 0 | 0 | 0 |
| Window Area (South)ft2 | 206 | 206 | 206 | 206 | 206 |
| Window Area (West)ft2 | 0 | 0 | 0 | 0 | 0 |
| Window Area (Horiz)ft2 | 0 | 0 | 0 | 0 | 0 |
| Datatype | Code Minimum | Improved Envelope | Improved HVAC | RecommendedEnerPHit by Component | EnerPHit by Demand |
|---|---|---|---|---|---|
| Ext. Wall - Fronthr-ft2-F/Btu | R-17.9 | R-17.9 | R-17.9 | R-19 | R-25 |
| Ext. Wall - Rearhr-ft2-F/Btu | R-17.9 | R-17.9 | R-17.9 | R-19 | R-25 |
| Floorhr-ft2-F/Btu | R-1.8 | R-10 | R-10 | R-19 | R-20 |
| Roof - Deckhr-ft2-F/Btu | R-31.3 | R-31.3 | R-31.3 | R-31.3 | R-45 |
| Roof - Slopedhr-ft2-F/Btu | R-38.5 | R-38.5 | R-38.5 | R-38.5 | R-45 |
| Thermal Bridge Allowance (% increase)% Increase | +30 % | +20 % | +20 % | +15 % | +10 % |
| Volumetric Air Leakage Rate (n50)ACH@50 | 3 | 2 | 2 | 1 | 1 |
| Envelope Air Leakage Rate (q50)cfm/ft2 | 0.3 | 0.2 | 0.2 | 0.1 | 0.1 |
| Window U-value (Installed)Btu/hr-ft2-F | U-0.27 | U-0.24 | U-0.24 | U-0.19 | U-0.17 |
| Window SHGC- | 0.4 | 0.4 | 0.4 | 0.4 | 0.4 |
| Datatype | Code Minimum | Improved Envelope | Improved HVAC | RecommendedEnerPHit by Component | EnerPHit by Demand |
|---|---|---|---|---|---|
| Ventilation System | 2-Extract air unit | 2-Extract air unit | 1-Balanced PH ventilation with HR | 1-Balanced PH ventilation with HR | 1-Balanced PH ventilation with HR |
| Ventilation Unit HR Efficiency% | 0 % | 0 % | 63.9 % | 74.8 % | 79.1 % |
| Ventilation Unit ER Efficiency% | 0 % | 0 % | 0 % | 0 % | 48.2 % |
| System HR Efficiency% | 0 % | 0 % | 63.9 % | 74.8 % | 79.1 % |
| Cold Air Duct Length (ea)ft | 16.4 | 16.4 | 16.4 | 16.4 | 16.4 |
| Cold Air Duct Insulation Thicknessinches | 2.05 | 2.05 | 2.05 | 2.05 | 4.09 |
| Heating System | Heat pump(s) | Heat pump(s) | Heat pump(s) | Heat pump(s) | Heat pump(s) |
| Cooling System | Elec. Heat Pump | Elec. Heat Pump | Elec. Heat Pump | Elec. Heat Pump | Elec. Heat Pump |
| DHW System | Heat pump(s) | Heat pump(s) | Heat pump(s) | Heat pump(s) | Heat pump(s) |
03
“Site Energy” represents the energy purchased by the building and delivered to the site by the utility. This is the most typical energy use figure assessed when considering a site “Net-Zero” building energy balance, or when considering the annual cost of energy for the building. This site-energy total is made up of 6 main groups: heating, cooling, hot-water, lighting, electric equipment (appliances, electric-vehicles, etc), and pumps / fans.
In order to assess the performance of the home across a range of options, we have simulated 5 distinct variants with different energy efficiency measures (see the Model Variants section for all the details on the specific variant inputs). In this case, compared to the “existing” home any of the variants assessed are likely to provide significant reductions in site energy consumption.
Annual site energy end uses by modeled variant, in kWh / year.
04
Carbon Dioxide and other types of pollution which results from energy consumption are mainly responsible for the increased warming of the earth’s atmosphere and water. In order to reduce the risk of global climate change it is important to reduce all CO2e (CO2 Equivalent) emissions related to the buildings, industry and transportation across all sectors. While there is much debate about the specific targets these reductions should achieve, one useful method suggests that by 2030 each individual will need to meet an annual ‘Carbon Budget’ of roughly 2.3 tons-CO2e per person for all activities. This would mean that an average individual’s annual carbon emissions might include approximately 1 ton-CO2e / year related to their housing and building inhabitation, 1 ton-CO2e / year for their transportation, and another 0.3 tons-CO2e / year for food. For reference, a single US-to-Europe round trip flight currently releases approximately 4 tons of warming gases into the atmosphere. This 1 ton/person target for building emissions gives us a useful benchmark for this building’s annual CO2e emissions. Given an average annual occupancy of approximately 4 people, this building should ideally see a total annual CO2e emissions footprint of less than about 4 tons-CO2e / year.
Based on the modeled source energy and fuel types for the various energy uses of the building we can approximate the average annual CO2e emissions which will result. CO2e emission totals shown below are those which result from fuel usage by the building for heating, cooling, hot-water and all other plug-loads. The total amount of CO2e emitted as a result of each use-type depends on both the amount of fuel used as well as the type of fuel (gas, electricity, etc.). Although fuel-fired heating systems are permitted by Code, for this evaluation we have modeled all variants with electric-powered heat-pump systems only.
Output Emission Rates used are from the NY (NYCW) Subregion. For more information on these factors see the EPA eGRID Data Explorer. Source Energy Factors for all fuel types are taken from the EPA EnergyStar Portfolio Manager Technical Reference (2023).
While CO2e emissions are calculated within the Passive House energy modeling software (PHPP), CO2e is not one of the certification metrics for Passive House projects. The following is for informational purposes only.
Operational CO2e by modeled variant, in tons CO2e / year.
05
In order to evaluate a building’s performance, total annual energy consumption is key, as shown above. However, in addition to this top line figure the ‘Passive House’ framework suggests that the building should also meet additional heating and cooling annual energy demand performance targets. It is also useful to compare the peak-heating and peak-cooling loads to the recommended limits for Passive House buildings. While these limits are not required for certification in all cases, it is still good practice to attempt to meet them where possible. Where the home fails to meet these targets is a clear indication that improvements are possible.
Shown below are results for these assessment metrics, for each of the tested variants.
Modeled variants shown in PHPP order.
Values in kWh.
Values in kWh.
Values in W.
Values in W.
06
For all the modeled cases shown in the following sections, climate data from the nearest weather station was used.
The data from this climate set is illustrated here for reference purposes. It should be noted that for the Passive House energy models, monthly average climate data are used and therefore may appear different from the more typical ASHRAE hourly data shown in some other US Energy Modeling programs. The monthly data is all derived from the same sources (local weather stations) as the typical ASHRAE data however.
Monthly PHPP climate temperatures, in degF.
07
The following is for informational purposes only.
Passive House is a high-performance building standard focused on reducing heating, cooling, hot water, lighting, appliance, and source-energy use while improving comfort and enclosure durability.
PHI and Phius are separate certification systems. In this design-analysis report, these standards are used as reference targets for comparing model variants; actual certification requires the applicable certifier review, final documentation, construction QA, commissioning, and airtightness testing.
| Energy Demand | |
|---|---|
| Yearly Heating Demand | 4.75 kBtu/sf-yr |
| Yearly Sensible Cooling Demand | 4.75 kBtu/sf-yr |
| Yearly Latent Cooling Demand | +0.63 kBtu/sf-yr |
| Primary Energy Demand | 38 kBtu/sf-yr |
| Airtightness | |
| Blower Door Test Result | 0.6 ACH@50 |
This is the original PHI certification level, with very low levels of heating and cooling energy consumption. Note that for some locations and climates the threshold levels for this certification may be impractical or unfeasible.
| Energy Demand | |
|---|---|
| Yearly Heating Demand | 9.50 kBtu/sf-yr |
| Yearly Sensible Cooling Demand | 9.50 kBtu/sf-yr |
| Yearly Latent Cooling Demand | +0.63 kBtu/sf-yr |
| Primary Energy Demand | 38 kBtu/sf-yr |
| Airtightness | |
| Blower Door Test Result | 1.0 ACH@50 |
This PHI certification level is very similar to the 'classic' new-construction but with a higher annual heating energy demand limit, and a slightly higher total air-change-rate than the 'classic'. This certification is especially well suited to smaller (single-family, etc.) buildings and often allows the design team to avoid the use of high solar-heat-gain glazing, which improves occupant comfort and summer-season performance.
| Energy Demand | |
|---|---|
| Annual Heating Demand Limit | 7.3 kBtu/sf-yr |
| Annual Cooling Demand Limit | 6.9 kBtu/sf-yr |
| Peak Heating Load Limit | 5.4 Btu/hr-sf |
| Peak Cooling Load Limit | 2.5 Btu/hr-sf |
| Net Source Energy Demand Limit | 5,400 kWh/person-yr |
| Airtightness | |
| Airtightness Limit | 0.06 cfm/ft-envelope at 50 Pa |
This is the Phius certification level recommended for this building. This certification prioritizes low levels of heating and cooling energy use, and calibrates the Source Energy target to feasible level for many multi-family and non-residential buildings
| Energy Demand | |
|---|---|
| Annual Heating Demand Limit | 7.3 kBtu/sf-yr |
| Annual Cooling Demand Limit | 6.9 kBtu/sf-yr |
| Peak Heating Load Limit | 5.4 Btu/hr-sf |
| Peak Cooling Load Limit | 2.5 Btu/hr-sf |
| Net Source Energy Demand Limit | 0 kWh/person-yr |
| Airtightness | |
| Airtightness Limit | 0.06 cfm/ft-envelope at 50 Pa |
This certification level is similar to the Phius CORE except that buildings meeting this certification must demonstrate a 'net zero' source energy balance.